What is Performance SLA?
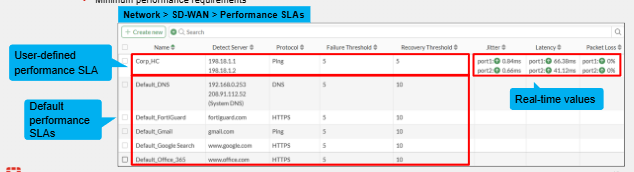
Performance SLA is used to monitor the health of a member. We can monitor the below:
- **State **- Whether the SD-WAN member is alive or dead
- Performance - Packet loss, Latency and Jitter values are monitored. If a link does not match the configured criteria we can fail over to a link that does. These values are monitored in real time.
- SLA Targets - We can optionally define SLA targets which as mentioned is the minimum critera that is required in terms of performance.
- Mean Opinion Score - This is the combination of Packet Loss, Latency and Jitter values and all three combined to help with SD-WAN steering the WAN traffic.
Its important to notice that performance SLA is not mandatory but highly recommended in an SD-WAN deployment. Otherwise you can have a situation where SD-WAN is steering traffic to an interface which is dead, affectively blackholing traffic. There are several Performance SLA's configured by default that we can utilise
Active vs Passive Monitoring
Active Monitoring
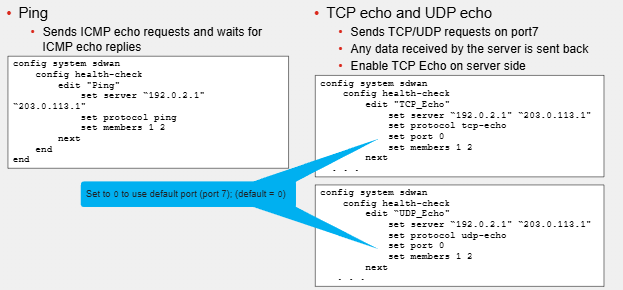
- This is when we send period probes sent to configured servers. These severs are typically referred to as "Health Check Servers". These servers act as beacons.
- We can monitor the state or the performance of SD-WAN members.
- We can use General-Purpose protocols such as PING, UDP echo, TCP-Connect etc. This can be used to monitor link quality regardless of application type the destination server is running. Disadvantage of these is that for example ping can be blocked or rate-limited as ping is easy to do ICMP Flood DDoS with. TCP/UDO echo or TWAMP can be used as alternative. We can modify the default port.
- Application Specific probes such as DNS, FTP, HTTP and HTTPS. This is more accurate for steering
- IPv6 is also supported, except TWAMP, TCP Echo, and HTTP/HTTPS not supported.
- The default probe interval is 500 ms and as mentioned previously the default failure and restore thresholds are at 5 probes
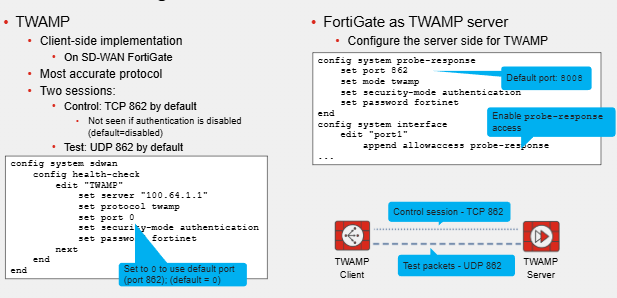
- TWAMP stands for Two-Way Active Management Protocol
- Control is to authenticate endpoints and test is to exchange packets to measure performance.
- If authentication is disabled (which is is by default) only the test session is sent.
Passive Monitoring
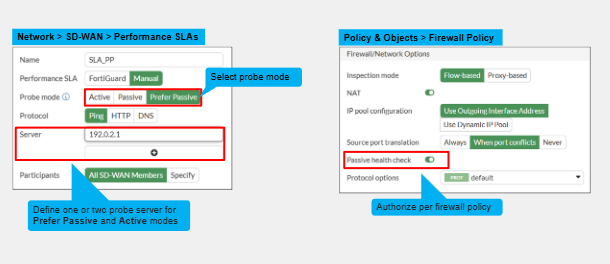
- This is based on the member traffic.
- This is useful alternative to active monitoring. In active monitoring the more we have the more traffic is generated in the network.
- Reduces traffic.
- Packet loss, jitter and latency monitored based on TCP traffic. This measures based on actual traffic based on the member. This can be more accurate than active monitoring.
- Latency measured based on Round Trip Time during TCP setup and teardown process.
- Jitter and packet loss is based on TCP headers.
- DOES NOT DETECT DEAD MEMBERS.
- Cannot compare traffic to other links in Passive Monitoring.
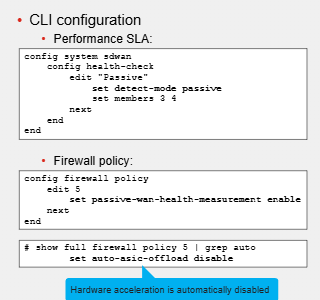
Per Application Passive Monitoring
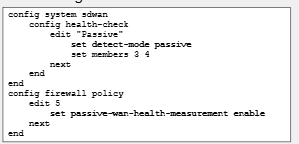
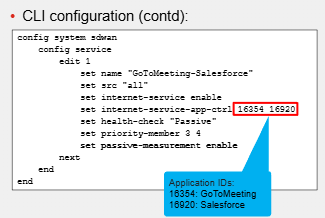
- Since metric is based on actual traffic passing through members, its more accurate. However, if we have multiple applications for the same member the average is taken and calculated. This can include irrelevant applications in the metrics.
- We cannot be granular with this and can affect SD-WAN steering.
- Per-Application Passive Monitoring it allows FortiGate to measure member quality based on applications selected in the SD-WAN rules. We can select an ISDB or application name. Metric is then calculated for each of these and average is taken in this example for members 3 and 4.
Prefer Passive Monitoring
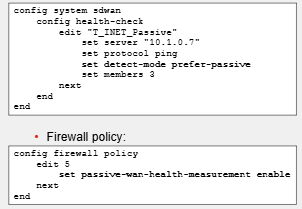
This is a mix of passive and active monitoring.
- It will be passive monitoring when there is TCP traffic going through the SD-WAN member.
- It will be active when no TCP traffic has been detected for 3 minutes. The configure probe will be actively used to detect state and performance of the member. ONLY in active monitoring.
- Dead members will be detected during the active monitoring
Performance SLA GUI Configuration
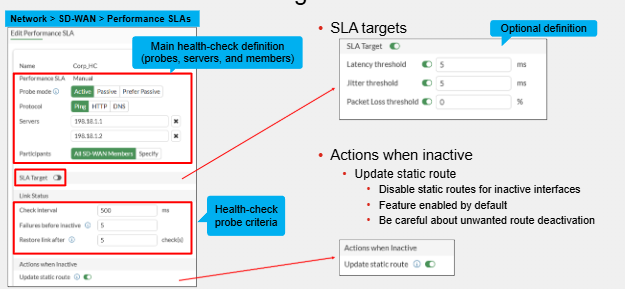
- An SD-WAN member by default is considered dead after 5 consecutive missed probes - When declared dead it is not used anymore to forward traffic.
- An SD-WAN member will become alive again after 5 consecutive successful probes.
- One SLA target PER Performance SLA. To configure more we can do this via the CLI, then they will be available to view on the GUI.
- Be careful with the "Update static route" option. It is enabled by default but will remove static routes when the SD-WAN member is dead - This can affect non SD-WAN members that need to egress to this destination using this static route.
Performance SLA CLI Configuration
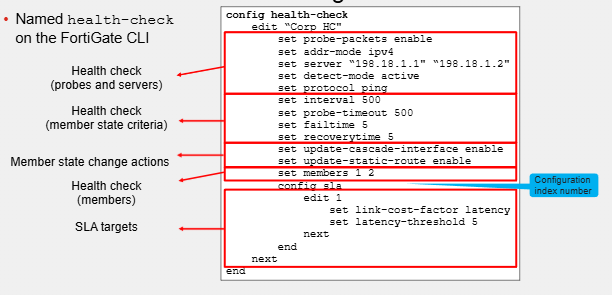
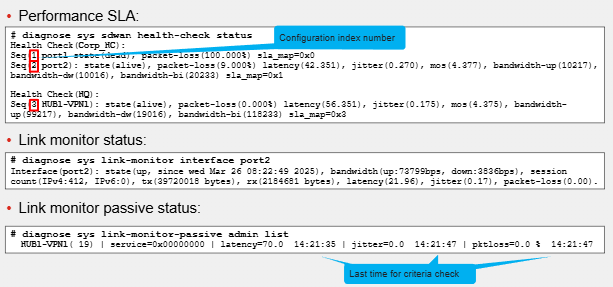
- Performance SLA is called "Health-Check" in the CLI
- Members referenced using configuration index number.
FortiGuard SLA Database
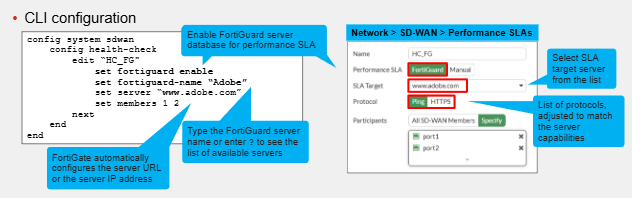
- This is a database of popular SaaS applications and internet destinations Fortinet has documented.
- This is a Licensed feature available in the SD-WAN service bundle - the benefit of this feature is we can set a popular service as a performance SLA. On this page we set it to Adobe. This feature also provides recommendations on the probes and protocols to select based on the capabilities of the server.
- Some SLA targets will support Ping and HTTPS or one or the other.
- This can be configured on the GUI or he CLI
- This feature is available from 7.6.1
SLA Targets
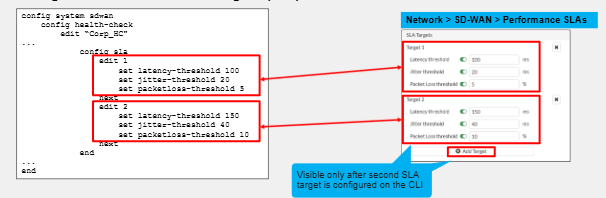
- SLA Targets are optional. But is mandatory when using SD-WAN rule that uses Lowest Cost SLA Strategy.
- These define the performance requirements a live SD-WAN member must meet.
- We can define the Latency, Jitter and packet-loss threshold.
- These check state and quality of the members
- These can be great for testing and especially for VOIP ensuring that Voice Packets only egress out of interfaces that meet a certain latency requirement.
- One SLA target per Performance SLA - CLI required for second SLA Target.
- Different SLA targets allows for different Performance requirements for same monitoring mode. We can then select the best SLA target for a given application. By this, we mean we can select a performance SLA that has active, passive or prefer passive monitoring modes and then select applications based on these and test it and see what is the best for our application. We can also divide it based on strict and loose Performance SLA, where the strict one is where critical/sensitive traffic egresses and loose egresses everything else.
Mean Opinion Score
- This is for measuring quality of VoIP traffic on a scale of 1 to 5. 5 being the best.
- It generates this score by combining latency, jitter and packet loss and codac information to create a formula.
- This can be used for steering VoIP traffic.
- This can only use the lowest cost SLA strategy.
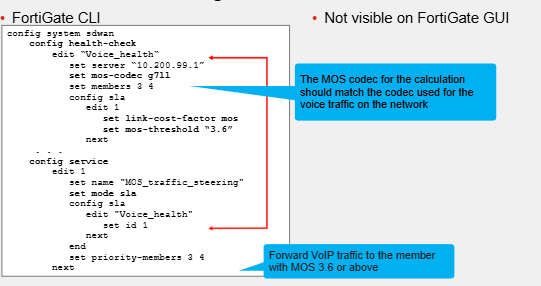
- MOS is recommended for VoIP traffic
- MOS is not available on the GUI.
- MOS-Threshold informs of the minimum score required to steer traffic to an SD-WAN member.
Monitoring Performance SLA & Member State
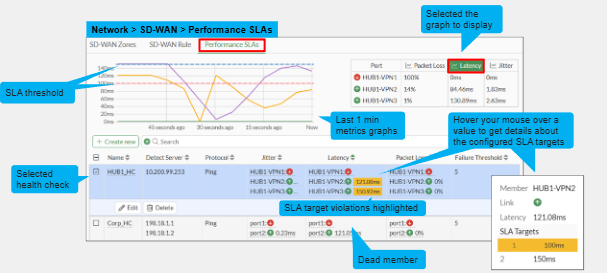
- Alive members = Green up icon
- Dead = Red down icon.
Comments