SD-WAN Widget
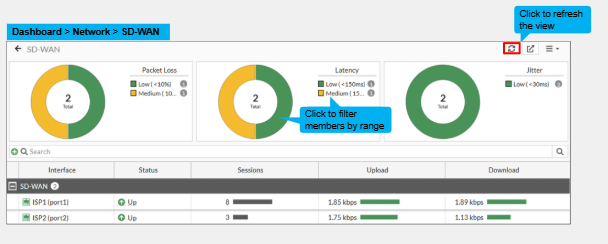
The SD-WAN Widget can monitor the SD-WAN member as well as its use case. We can also see the Packet Loss, Latency and Jitter of these members. This view does not automatically refresh, you must manually refresh this page.
SD-WAN Routing
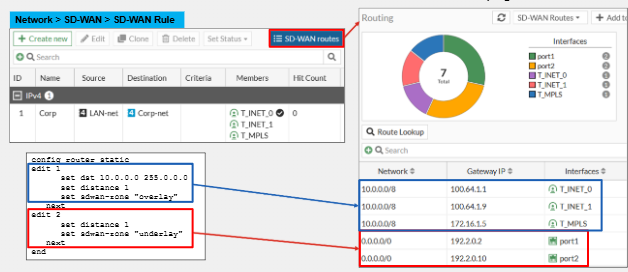
Under this tab we can view the routes that are associated with SD-WAN members. You can also navigate to the Network Monitor -> Routing -> Filter by SD-WAN Routes.
Monitoring Member Health
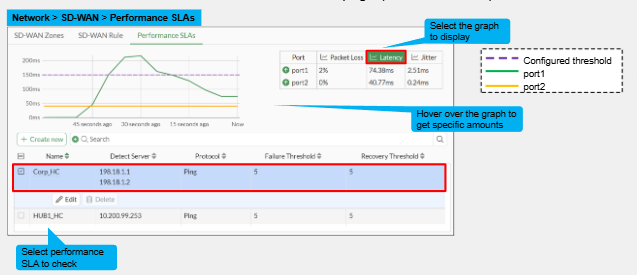
Member health is based on Performance SLA that we have configured. Select the performance SLA we want to monitor whether its packet loss, latency or jitter and then we can see a graph and and health for the relevant members. The information on the graph is limited to the last 60 seconds based on the performance SLA parameters.
Reviewing Traffic Logs
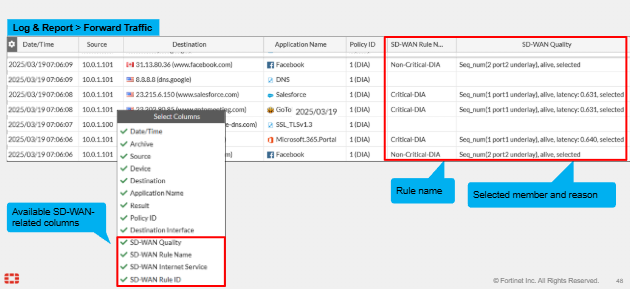
It is required to enable the SD-WAN columns. The benefit of this is we can see the traffic steering and the SD-WAN rule its hitting and which SD-WAN member it selected (if load balancing) and the reason it was selected.
In this example the Non-Critical-DIA instructs FortiGate to steer traffic to port2 only if the port is alive which matches the selected reason. The second rule matches DNS and does not match any SD-WAN rules so the SD-WAN rules are empty.
The third session is one the FTG identified as sales force application and used the Critical-DIA SD-WAN Rule and selected the port1 as the interface to egress the traffic based on the performance SLA of latency.
SD-WAN Events
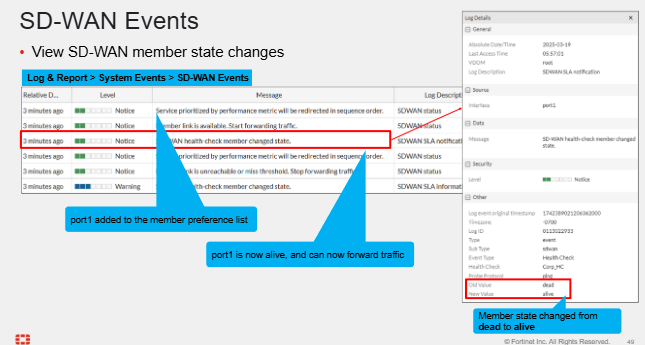
This page reports state changes of SD-WAN members. Whether they are up and functioning or down. We can click on the log entry and drill down into it.
Recommended materials
https://training.fortinet.com
Comments